


PHOTOS


Hi-Res Research Graphics

Earth Day and the Hockey Stick: A Singular Message
The hockey stick temperature reconstruction from 1999 (blue) along with the data record (red) and the 2013 “PAGES2k” temperature reconstruction (green). Credit: Klaus Bitterman Wikimedia (CC BY-SA 4.0)

IPCC 2001 3rd Assessment Report SPM
Time reconstructions [blue] and instrumental data [red] for Northern Hemisphere mean temperature (NH). In both cases, the zero line corresponds to the 1902-80 calibration mean of the quantity. Raw data are shown up to 1995 and positive and negative 2-sigma uncertainty limits are shown by the grey shaded region. The thick black line corresponds to a lowpass filtered version of the reconstruction. Credit: Intergovernmental Panel on Climate Change.
Read the Article | Supplementary information and data

Hockey Stick Curve
Time reconstructions [blue] and instrumental data [red] for Northern Hemisphere mean temperature (NH). In both cases, the zero line corresponds to the 1902-80 calibration mean of the quantity. Raw data are shown up to 1995. The thick black line corresponds to a lowpass filtered version of the reconstruction. Credit: Michael E. Mann.
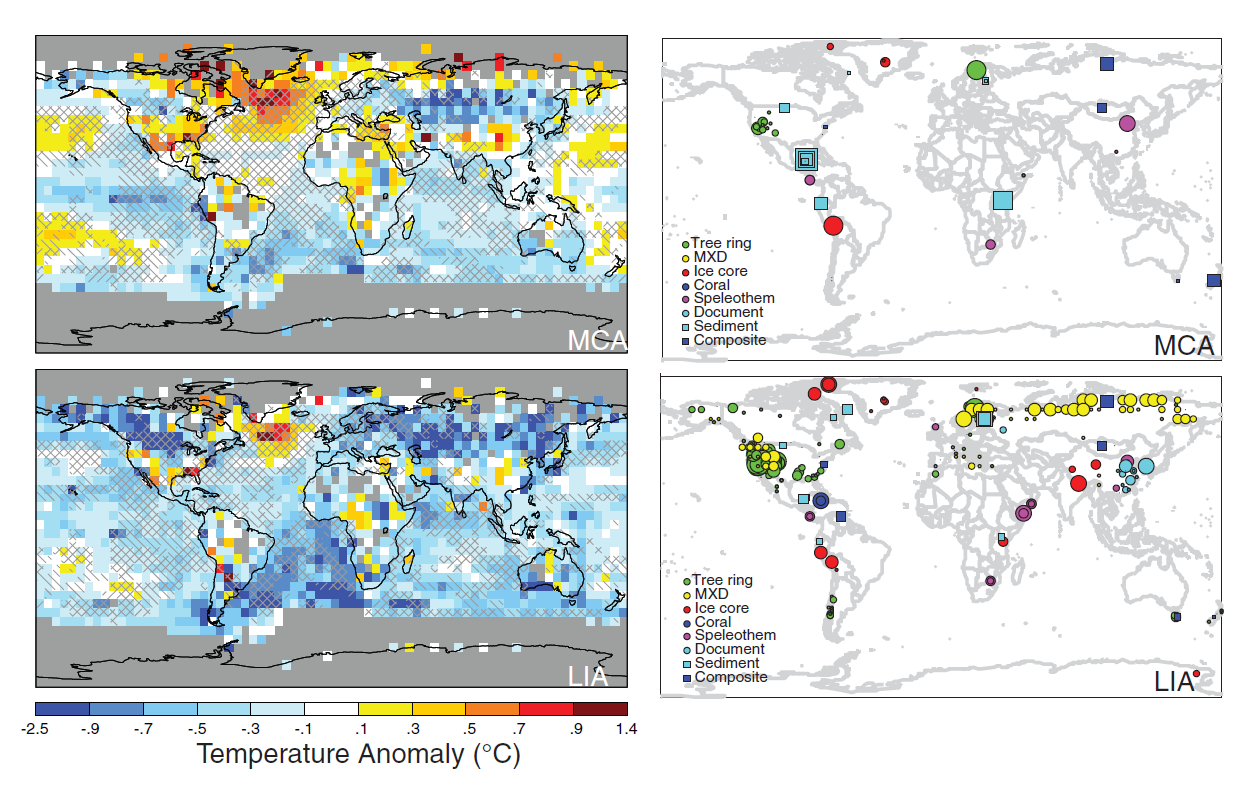
Reconstructed surface temperature pattern for MCA & LIA
Reconstructed surface temperature pattern for MCA (950 to 1250 C.E.) and LIA (1400 to 1700 C.E.). Shown are the mean surface temperature anomaly (left) and associated relative weightings of various proxy records used (indicated by size of symbols) for the low-frequency component of the reconstruction (right). Anomalies are defined relative to the 1961 1990 reference period mean. Statistical skill is indicated by hatching [regions that pass validation tests at the P = 0.05 level with respect to RE (CE) are denoted by / (\) hatching]. Gray mask indicates regions for which inadequate long-termmodern observational surface temperature data are available for the purposes of calibration and validation. Credit: American Association for the Advancement of Science.
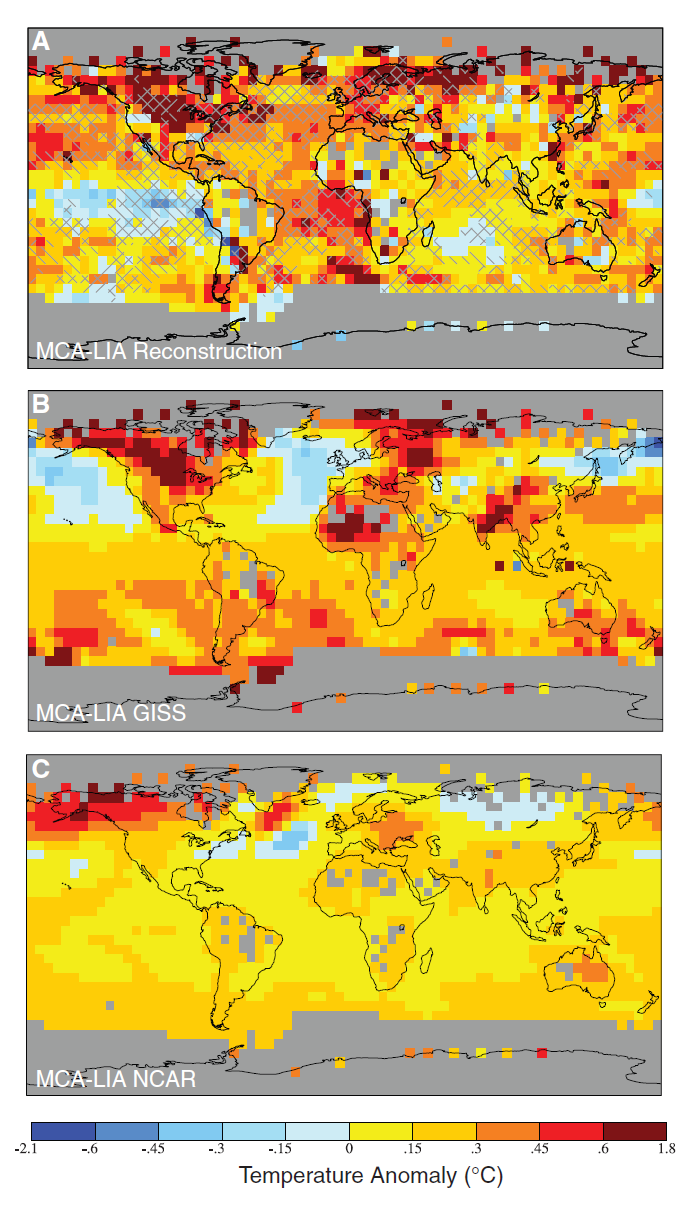
Spatial pattern of MCA-LIA surface temperature difference
Spatial pattern of MCA-LIA surface temperature difference in reconstructions and model simulations.
(A) Proxy-based temperature reconstructions,
(B) GISS-ER (using the same solar forcing difference used in the NCAR simulation shown is the ensemble mean), and
(C) NCAR CSM 1.4 simulation.
The observational mask has been applied to both model patterns for ease of comparison. Statistical skill for (A) is indicated with the same conventions as in Fig. 2 (statistical significance here indicates that the particular test statistic independently passed during both the MCA and LIA intervals). Credit: American Association for the Advancement of Science.
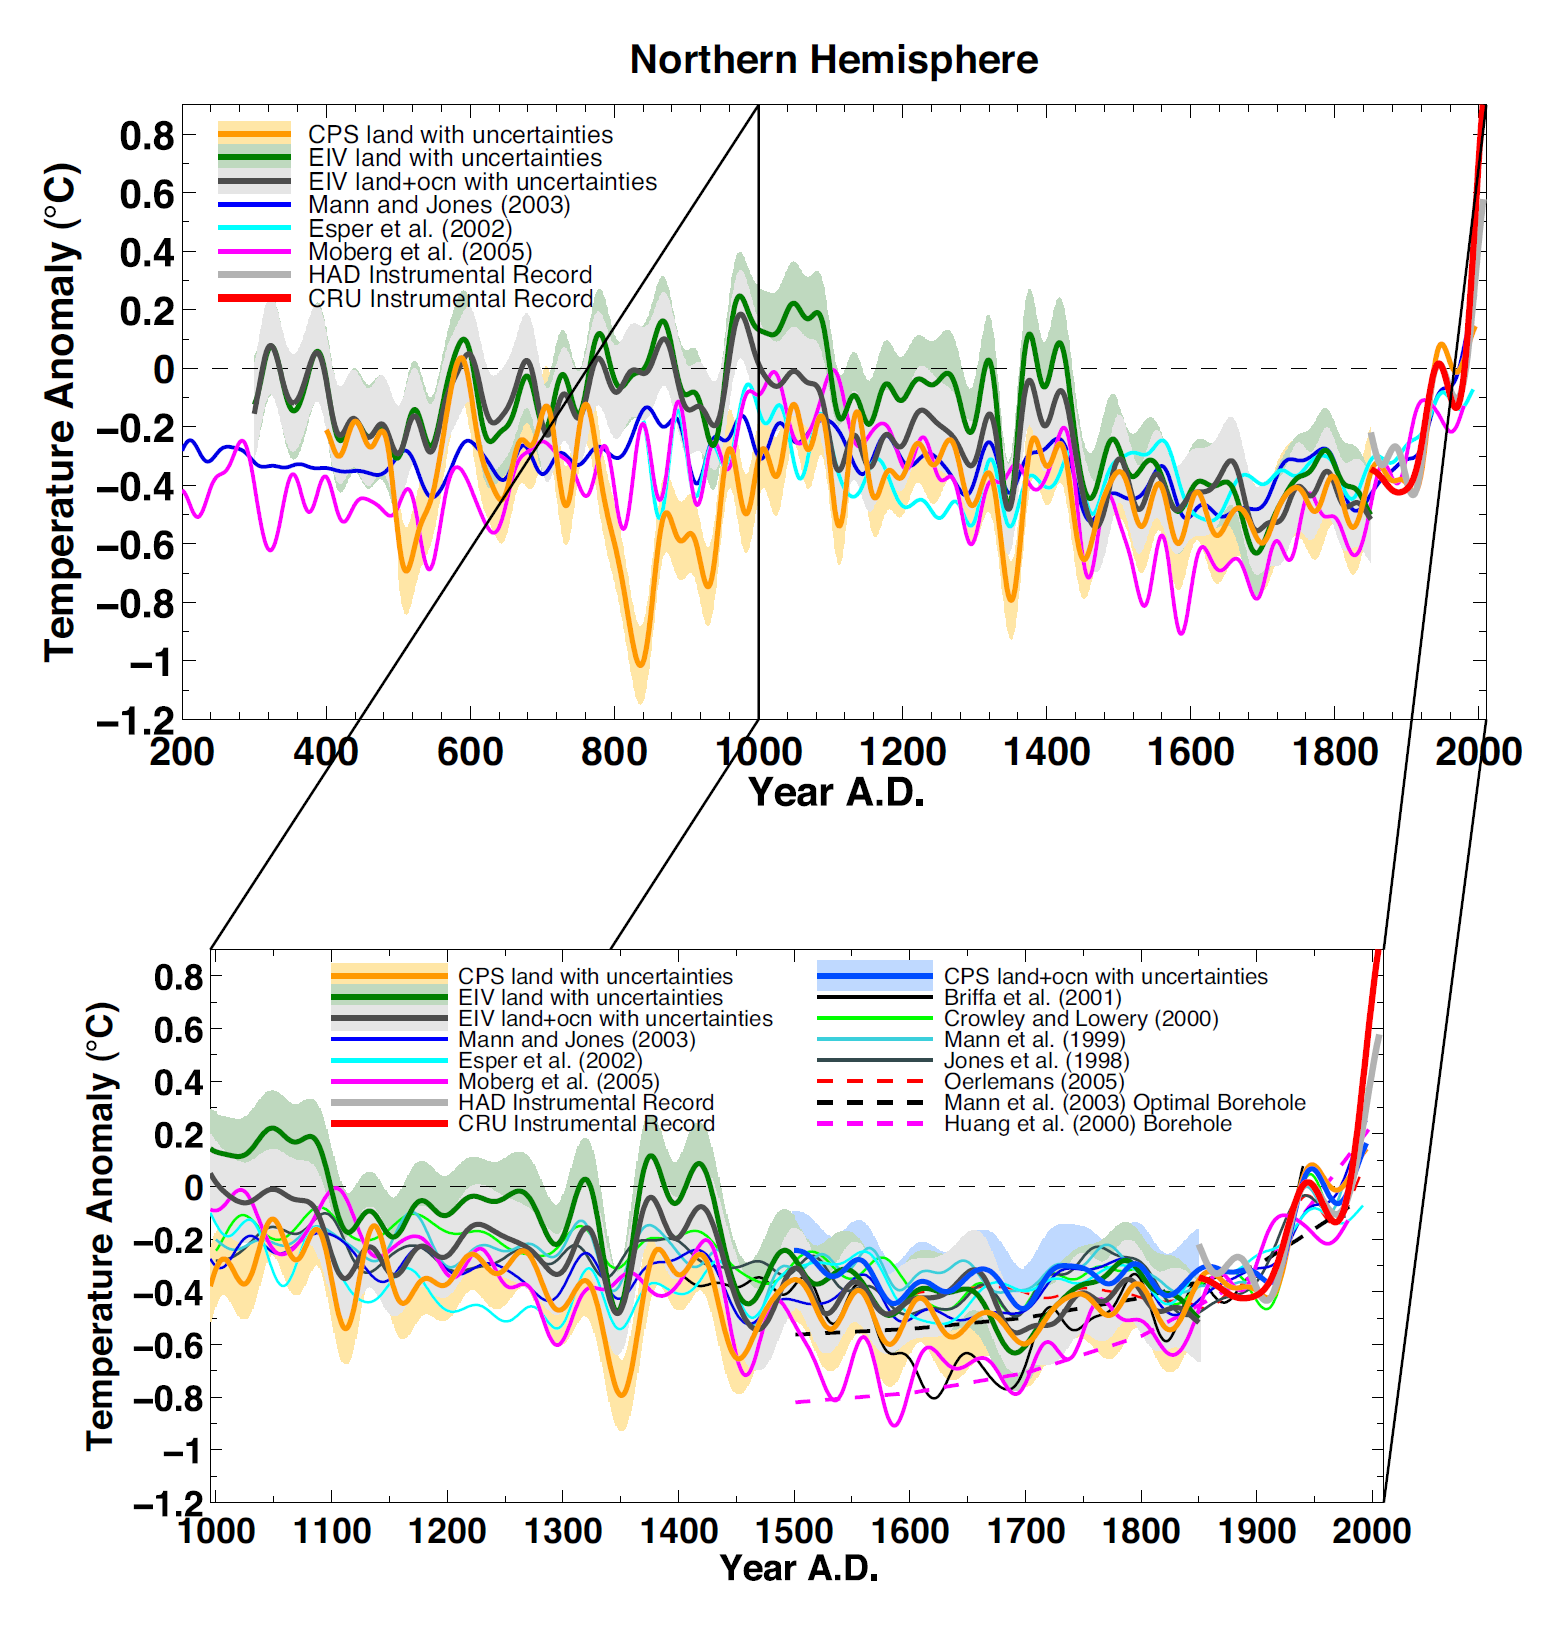
PNAS 2008 Reconstruction Comparison
Composite CPS and EIV NH land and land plus ocean temperature reconstructions and estimated 95% confidence intervals. Shown for comparison are published NH reconstructions, centered to have the same mean as the overlapping segment of the CRU instrumental NH land surface temperature record 18502006 that, with the exception of the borehole-based reconstructions, have been scaled to have the same decadal variance as the CRU series during the overlap interval (alternative scaling approaches for attempting to match the amplitude of signal in the reconstructed and instrumental series are examined in SI Text). All series have been smoothed with a 40-year low-pass filter as in ref 33. Confidence intervals have been reduced to account for smoothing. Credit: National Academy of Sciences.
Read the Article | Supplementary information and data
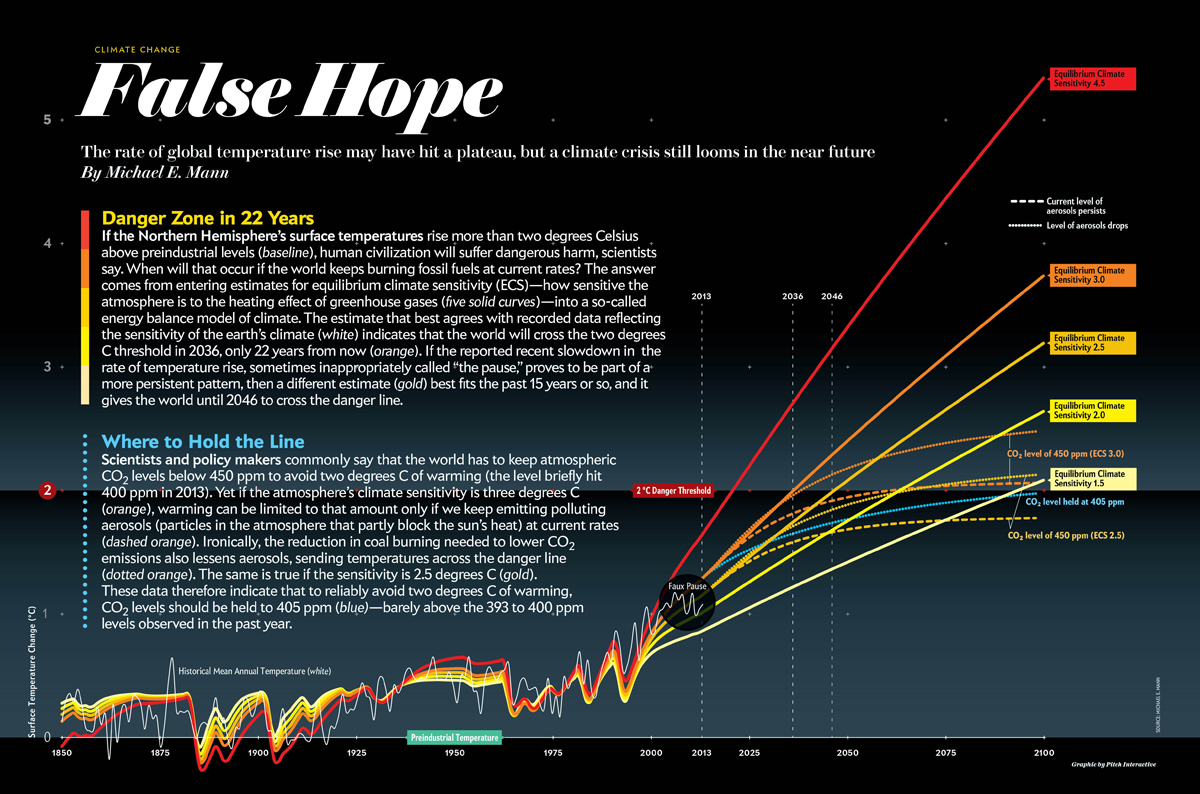
False Hope: Earth Will Cross the Climate Danger Threshold by 2036
Results from a simple energy balance model show the time to reach a critical warming threshold given different estimates of climate sensitivity. Results from scenarios were emissions of greenhouse gases are reduced are also shown.
Read the article | More information
Graphic Credit: Pitch Interactive, Source Credit: Dr. Michael E. Mann